Cultivate Michigan is a statewide campaign led by the Michigan Farm to Institution Network to encourage large, meal-serving institutions to source at least 20% of their food from Michigan farms.
Our role was to create a web site that promoted the campaign to the public through engaging content, allowed meal-serving institutions to sign up and participate in the program, and provided an institutional dashboard that tracked and displayed their food sourcing goals and progress through quarterly surveys.
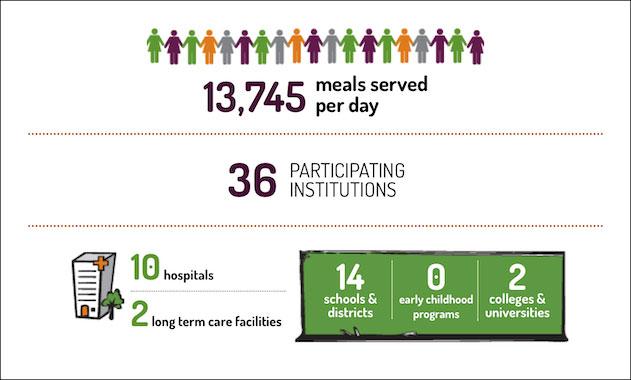
Infographic
Cultivate Michigan wanted to clearly and easily communicate program participation to the public. We created an infographic to summarize and display an overview of program participation. Over time, the infographic has shown both the increasing number of meals served per day and the increasing number of participating institutions. The display included engaging graphics and minimal text.

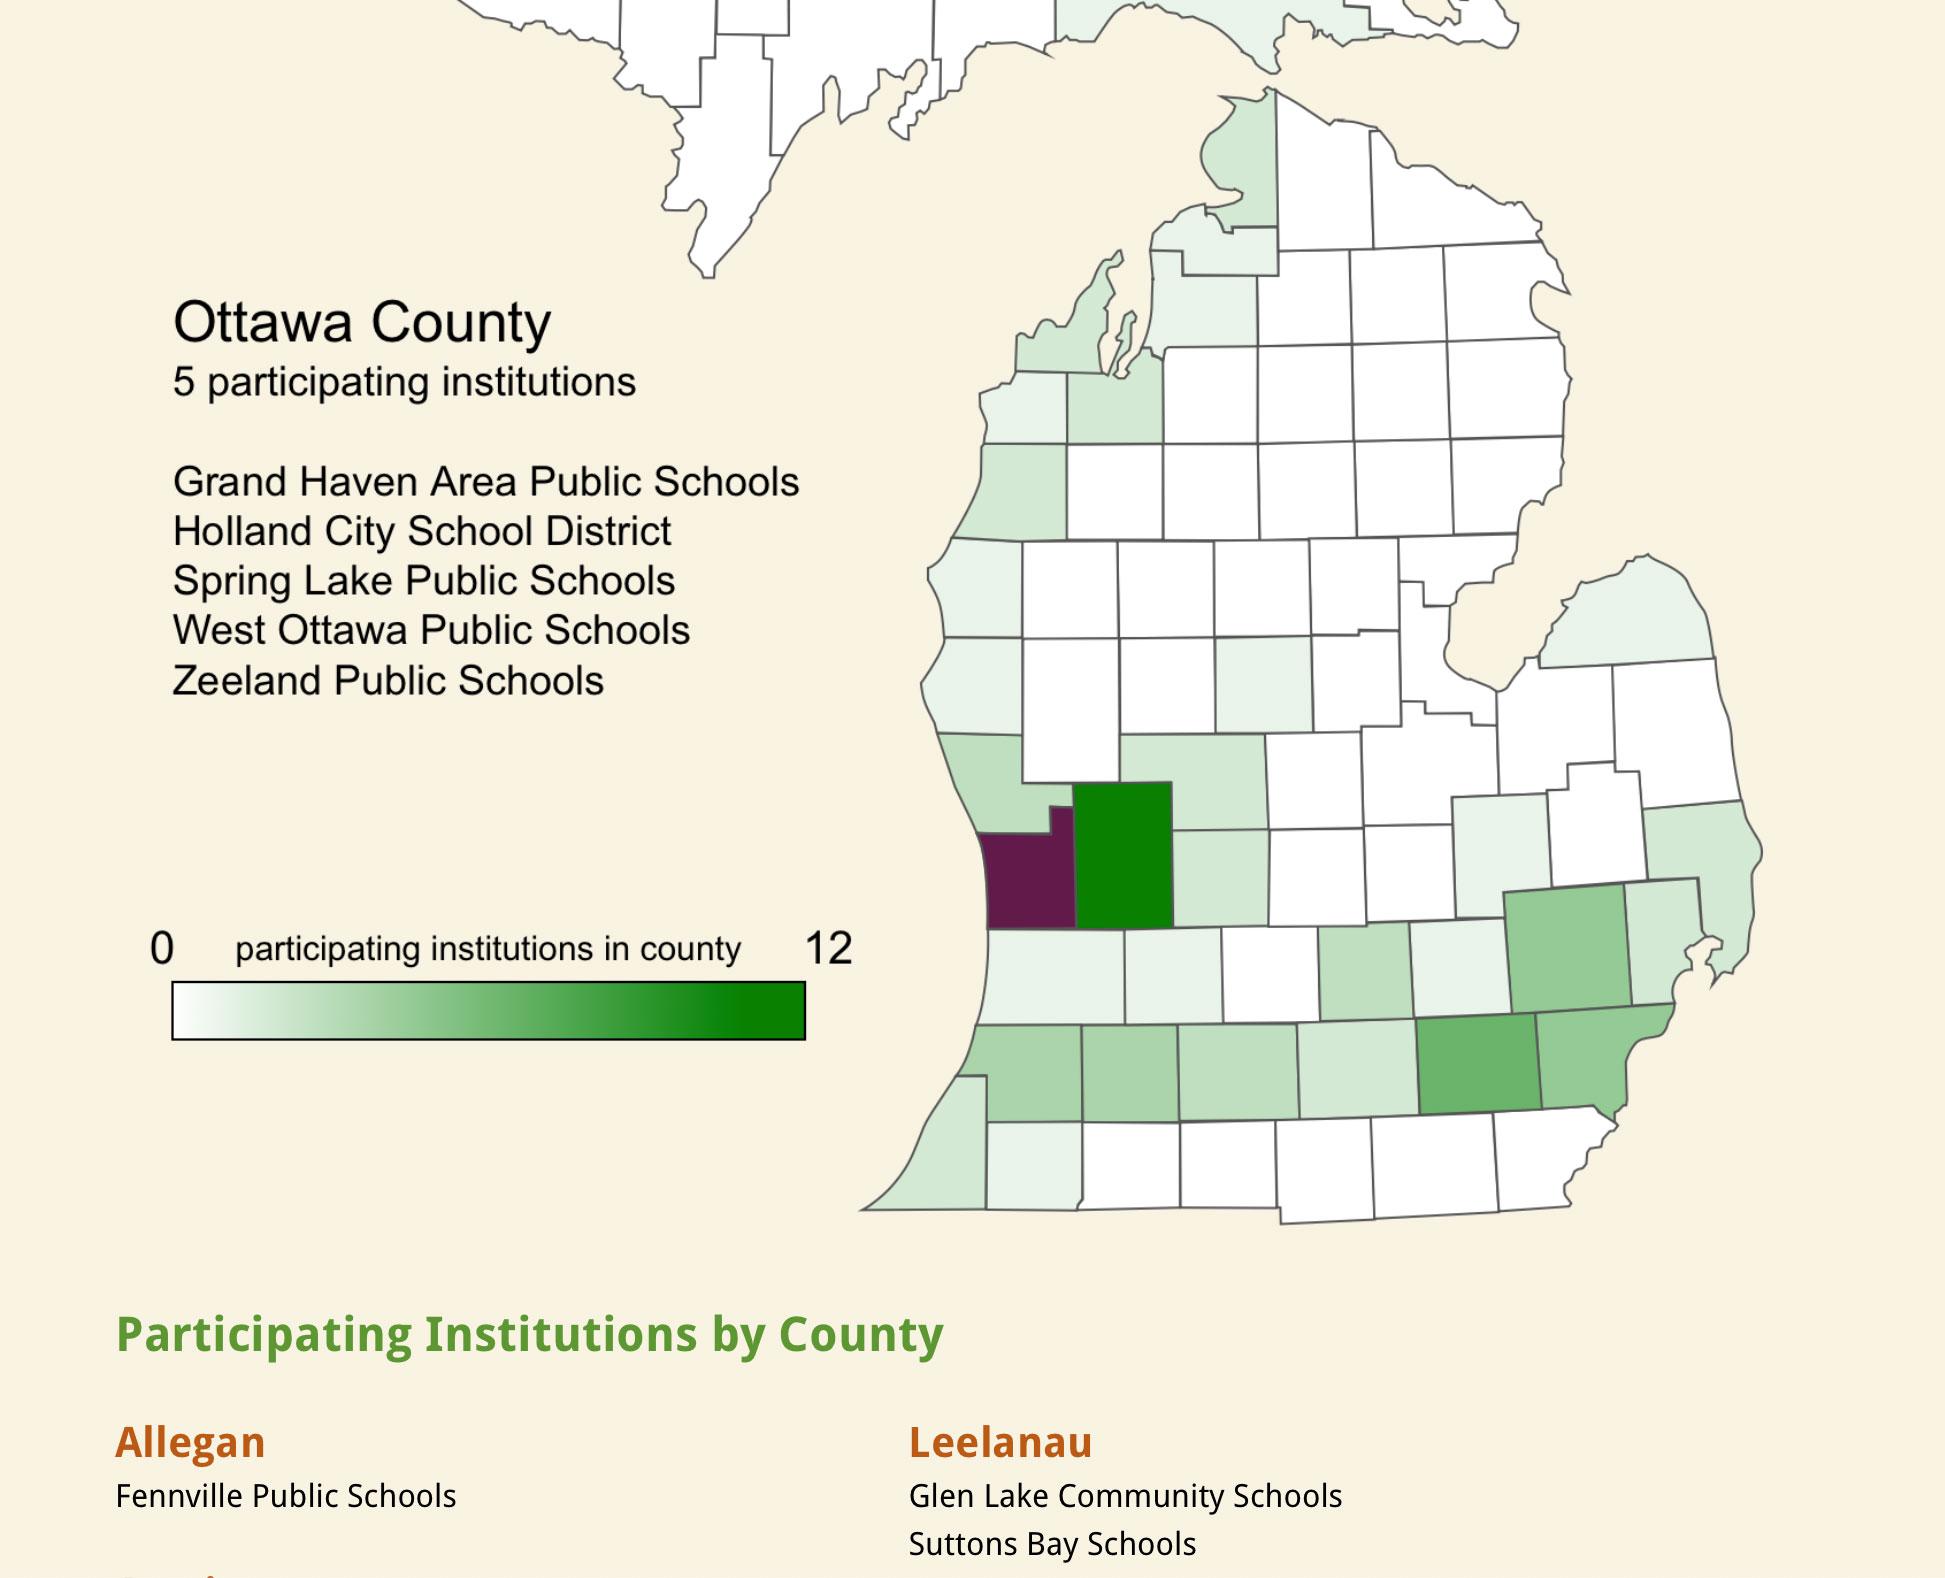
Map of Michigan
To encourage institutional participation, we created an interactive map of Michigan that updates automatically when new institutions sign-up. The map shows Michigan counties in shades of green, where darker colors indicate a higher number of participants. Hovering over and highlighting a county displays the number and names of the participating institutions in that county. A complete list of participants grouped by county is shown below the map.
Email List
Cultivate Michigan wanted to build an email list to keep current and prospective members informed about the program. We created a web sign-up form to send subscriber information and program interests to Constant Contact, an online email marketing system. Cultivate Michigan used Constant Contact to send Michigan Farm to Institution Network newsletter updates to their audience.
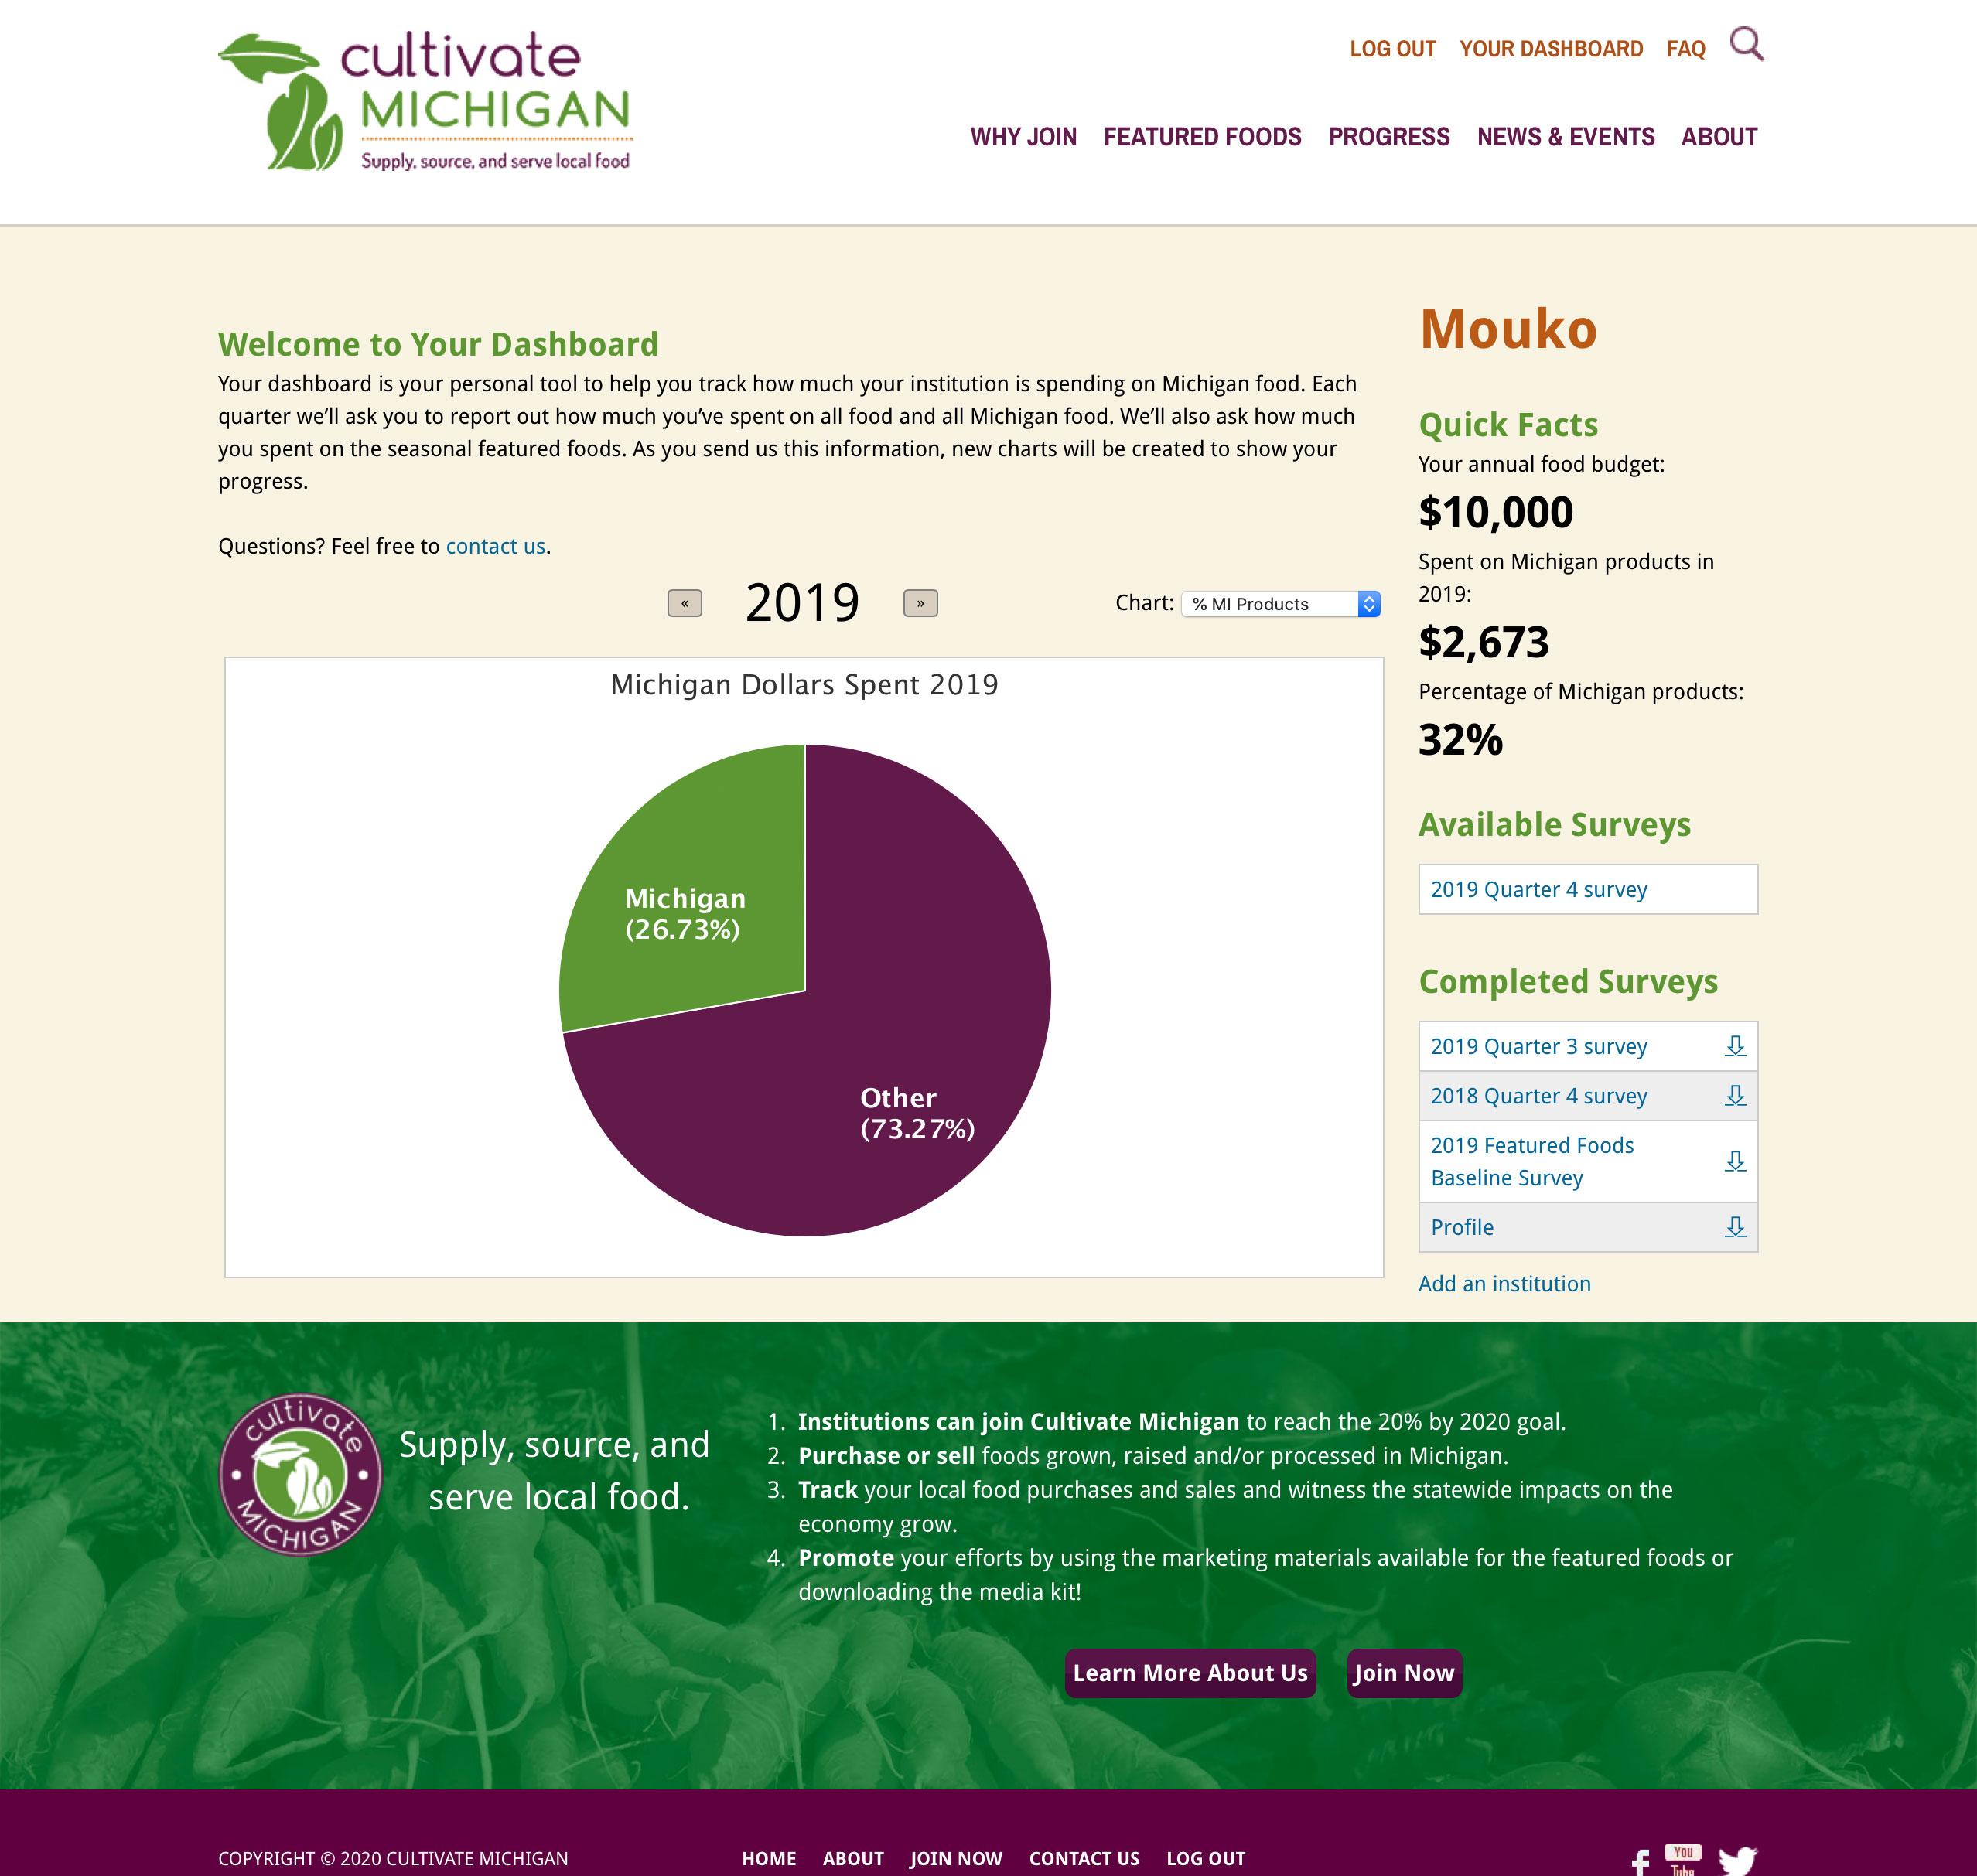
Dashboard
We created a dashboard for institutions to track their progress toward sourcing 20% of their food from Michigan farms. The dashboard shows Quick Facts, charts, and provides access to available and completed surveys. Quick Facts has information such as yearly budget and percent spent on Michigan grown food. The charts include a pie chart overview of dollars spent and a bar graph of quarterly purchases per food item. The dashboard is automatically updated based on the institution’s responses to quarterly surveys on food purchases.
Success
We worked closely with Cultivate Michigan in developing the project and continue to enjoy our ongoing relationship as the project evolves. A growing number of institutions have signed-up for Network membership and many have achieved their goal of sourcing at least 20% of their food from Michigan farms.
- Drupal
- JavaScript
- Constant Contact
- Photoshop